Chronicle
The chart widget behind Chronicle's decks
Most AI deck tools rent charts from a third party. We built ours, so every chart is native to the slide - on-brand, and editable down to the individual element.
Agentic chart generation - hand it an image or a PDF, get a live chart
About this feature
Chronicle’s charts are built in-house rather than embedded from a third party, and owning that path is the whole point.
They stay on brand. Switch the deck’s theme and every chart moves with it - palette, type, grid weight.
Every element is yours to control. Axes, gridlines, labels, legends, series colours, number formats - each one is addressable, because none of it is sealed inside someone else’s embed.
It opens up as needs change. Exposing another control, or another level of detail in the data, is a small change on our side rather than a request to a vendor - so when a customer wants more from a chart, they get it.
Use case it solves
Business decks live on numbers, and the numbers almost never arrive ready to use - they come as a screenshot, a PDF, or a link someone sent you. Rebuilding them by hand is the slowest part of making the deck, and the copy is stale the moment the data moves.
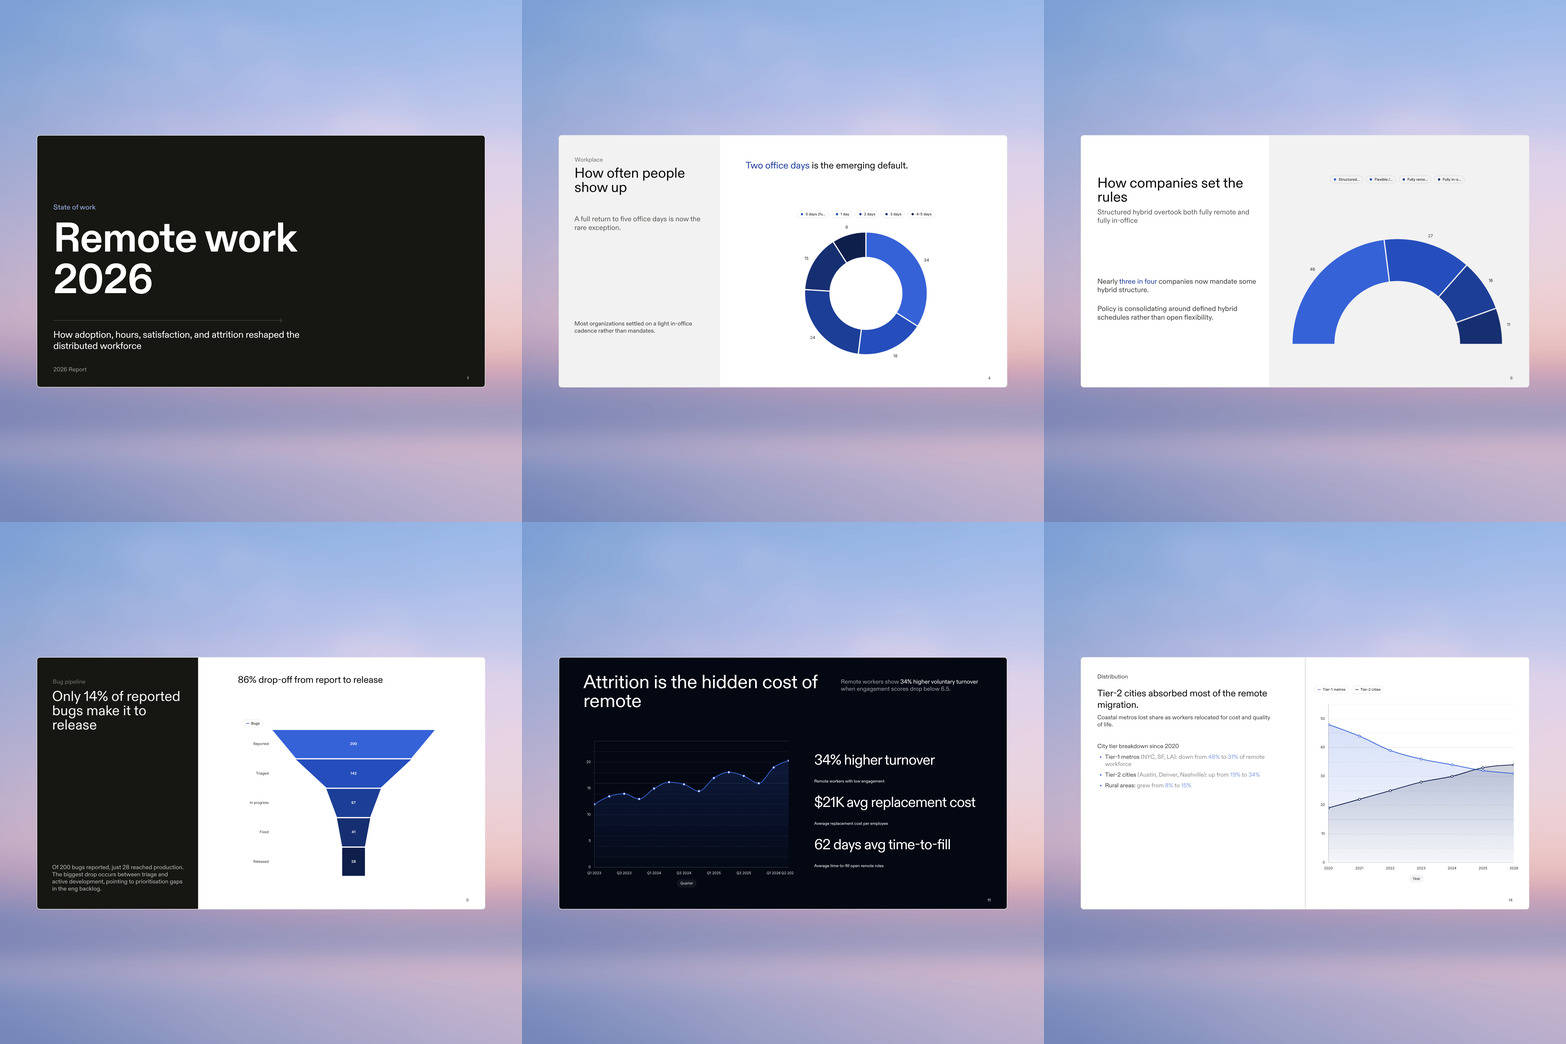
Hand the agent an image, a PDF, or a source on the web. It reads the values, picks the chart type that fits them, and places a live chart on the slide - themed, editable, and still a chart rather than a picture of one. The whole flow runs inside the presentation, so you never leave the deck to go fetch a spreadsheet.
My role
I designed the widget’s data model and the spec layer every chart type renders from, built the renderer, and wired the generation flow to the agent - including the validation that decides when a reading is trustworthy and when to stop and ask.